Components
Since v1.12.0, Pegasus supports collecting and visualizing monitoring metrics using Prometheus and Grafana.
- Prometheus
Prometheus is an open-source system monitoring and alerting toolkit. It stores metrics from monitored systems in its own time-series database, and provides a rich multi-dimensional query language to meet different visualization needs.
- Grafana
Grafana is an open-source analytics and visualization platform. It supports multiple mainstream time-series data sources including Prometheus. With query languages corresponding to each data source, Grafana retrieves and displays data, and through configurable dashboards, quickly presents these data in charts.
Note
This document only provides one approach to collect and visualize Pegasus monitoring data using Prometheus and Grafana. Pegasus does not include or maintain these components. For more details, please refer to their official documentation.
Configure Prometheus
This section describes how to configure Prometheus.
Step 1: Configure Pegasus services
By default, Pegasus does not push metrics to any external system. You need to modify the configuration to enable Prometheus push:
[pegasus.server]
  perf_counter_sink = prometheus
  prometheus_port = 9091
Note: To verify that Prometheus push is enabled on a Pegasus node, check whether
http://{pegasus_host}:{prometheus_port}/metricsis accessible.
Using Prometheus with Onebox
If you use onebox, first modify src/server/config.min.ini to enable Prometheus push. You do not need to change prometheus_port:
[pegasus.server]
  perf_counter_sink = prometheus
  prometheus_port = @PROMETHEUS_PORT@
In onebox mode, multiple Pegasus processes run on a single machine, so the Prometheus ports of replica, meta, and collector may conflict. Our current solution is to assign a dedicated Prometheus port to each process:
- collector: 9091
- meta: [9092, 9093, 9094…]
- replica: [9092+{META_COUNT}, 9093+{META_COUNT}, 9094+{META_COUNT}…]
For example, for a onebox cluster with 2 meta, 3 replica, and 1 collector:
./run.sh start_onebox -r 3 -m 2 -c
- meta1: 9092, meta2: 9093
- replica1: 9094, replica2: 9095, replica3: 9096
Step 2: Install and run Prometheus
wget https://github.com/prometheus/prometheus/releases/download/v2.15.2/prometheus-2.15.2.linux-amd64.tar.gz
tar xvfz prometheus-2.15.2.linux-amd64.tar.gz
cd prometheus-2.15.2.linux-amd64
Modify prometheus.yml under the Prometheus directory. Example template:
global:
  scrape_interval: 5s

scrape_configs:
  - job_name: 'pegasus'
    static_configs:
      - targets: ['collector_host:9091']
        labels:
          group: collector

      - targets: ['meta_host1:9091', 'meta_host2:9091', 'meta_host3:9091']
        labels:
          group: meta

      - targets: ['replica_host1:9091', 'replica_host2:9091', 'replica_host3:9091']
        labels:
          group: replica
      #
      # NOTE: Add the following lines if node exporter is deployed.
      # - targets:
      #     [
      #       'node_exporter_host1:9100',
      #       'node_exporter_host2:9100',
      #       ...
      #       'node_exporter_hostn:9100',
      #     ]
      #   labels:
      #     group: node_exporter
For the onebox cluster started by ./run.sh start_onebox -r 3 -m 2 -c, the actual configuration is:
global:
  scrape_interval: 5s

scrape_configs:
  - job_name: "pegasus"
    static_configs:
      - targets: ["0.0.0.0:9091"]
        labels:
          group: collector

      - targets: ["0.0.0.0:9092", "0.0.0.0:9093"]
        labels:
          group: meta

      - targets: ["0.0.0.0:9094", "0.0.0.0:9095", "0.0.0.0:9096"]
        labels:
          group: replica
After modifying prometheus.yml, start Prometheus:
./prometheus --config.file=prometheus.yml
Open http://localhost:9090. Seeing the following page indicates success for this step:
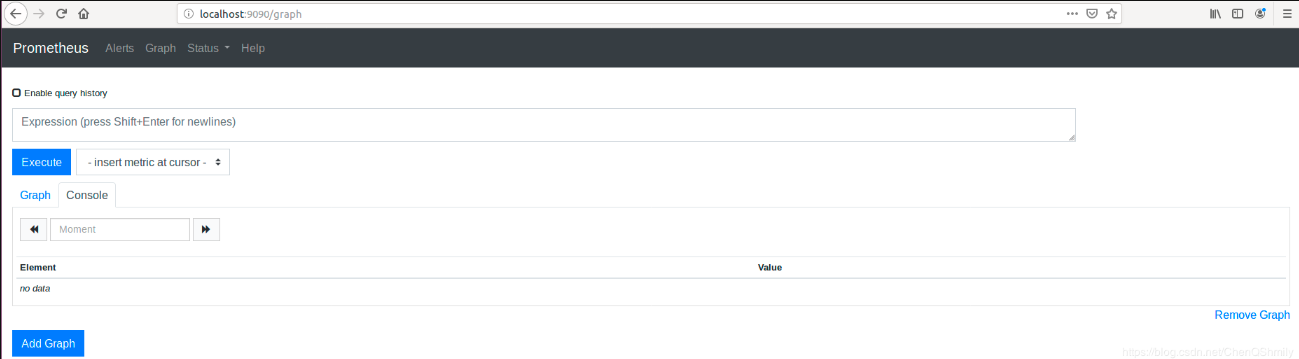
Note: To verify Prometheus configuration, check http://{prometheus_host}:9090/targets to view the scrape status of each node.
In the Expression input box, type your query and click Execute to display the results in the Table tab. Select Graph to view the time series chart.
Note
-
In real operations, we often need system-level metrics such as cpu.busy, disk.iostat, etc. When deploying Pegasus clusters, consider deploying a node exporter on each machine. See: Node Exporter
-
Alert Manager is Prometheus’s alerting component, which requires separate deployment (solution not provided here; refer to official docs). With Alert Manager, users can configure alert policies and receive notifications via email, SMS, etc.
-
Currently our
prometheus.ymluses static configuration (static_configs). Its drawback is that you must manually update the config when scaling. Prometheus supports multiple dynamic service discovery mechanisms (e.g., k8s, Consul, DNS). You can customize based on your needs. See: Configuration, Custom SD
Configure Grafana
This section describes how to configure Grafana.
Step 1: Install and run Grafana
Download Grafana binary:
wget https://dl.grafana.com/oss/release/grafana-6.0.0.linux-amd64.tar.gz # if it fails, try adding --no-check-certificate
tar -zxvf grafana-6.0.0.linux-amd64.tar.gz
cd grafana-6.0.0
Start Grafana:
./bin/grafana-server web
If you see output like below, Grafana is started successfully:
INFO[07-24|14:36:59] Starting Grafana                         logger=server version=6.0.0 commit=34a9a62 branch=HEAD compiled=2019-02-25T22:47:26+0800
...
INFO[07-24|14:37:00] HTTP Server Listen                       logger=http.server address=0.0.0.0:3000 protocol=http subUrl= socket=
INFO[07-24|14:37:00] cleanup of expired auth tokens done      logger=auth count=2
Step 2: Add Prometheus as a data source
-
Log in to Grafana:

- Default address: http://localhost:3000
- Default username:
admin - Default password:
admin
Note: You can skip the Change Password step.
-
Click Configuration in the Grafana sidebar, then Data Sources.
-
Click Add data source.
-
Specify the data source information:
- In Name, give the data source a name.
- In Type, select Prometheus.
- In URL, specify the IP address of Prometheus.
- Specify other fields as needed.
-
Click Add to save the new data source.
Step 3: Import Pegasus Dashboard
Pegasus provides a dashboard with basic monitoring. The corresponding JSON file: Pegasus dashboard JSON
After downloading the JSON, import it into Grafana:
Open Grafana, click the “+” on the left, select Import, and go to the import page.
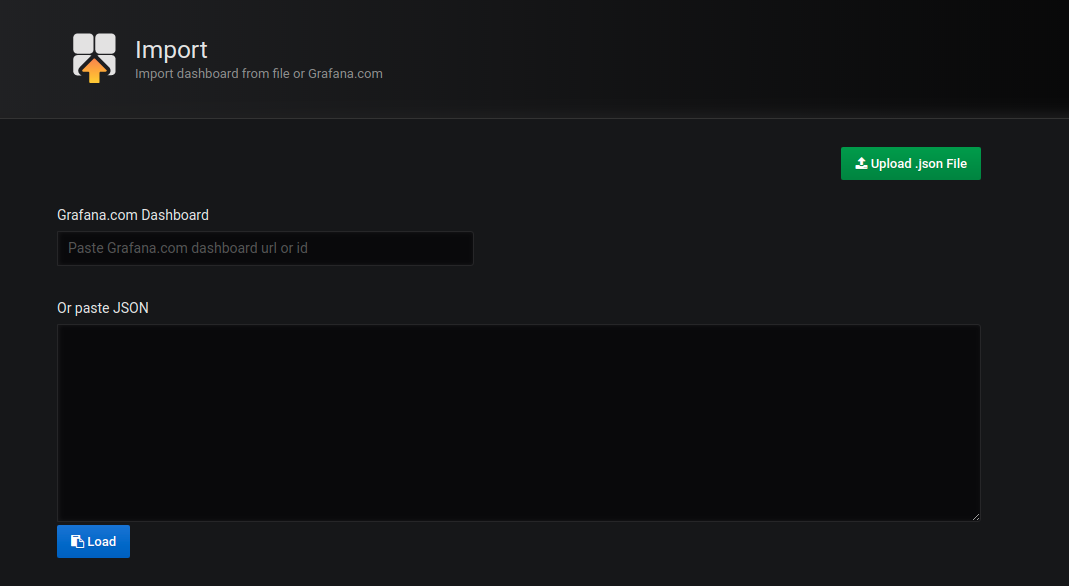
Click the “Upload .json File” button at the top right, then select the file. After selection, you will see the following page:
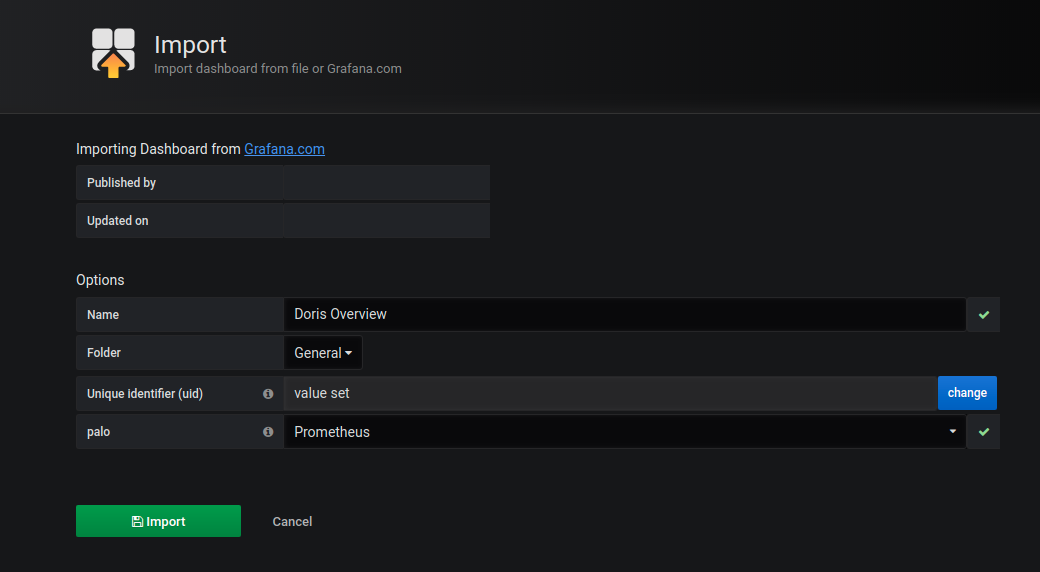
Click “import” at the bottom left to complete the import and open the Pegasus Dashboard:
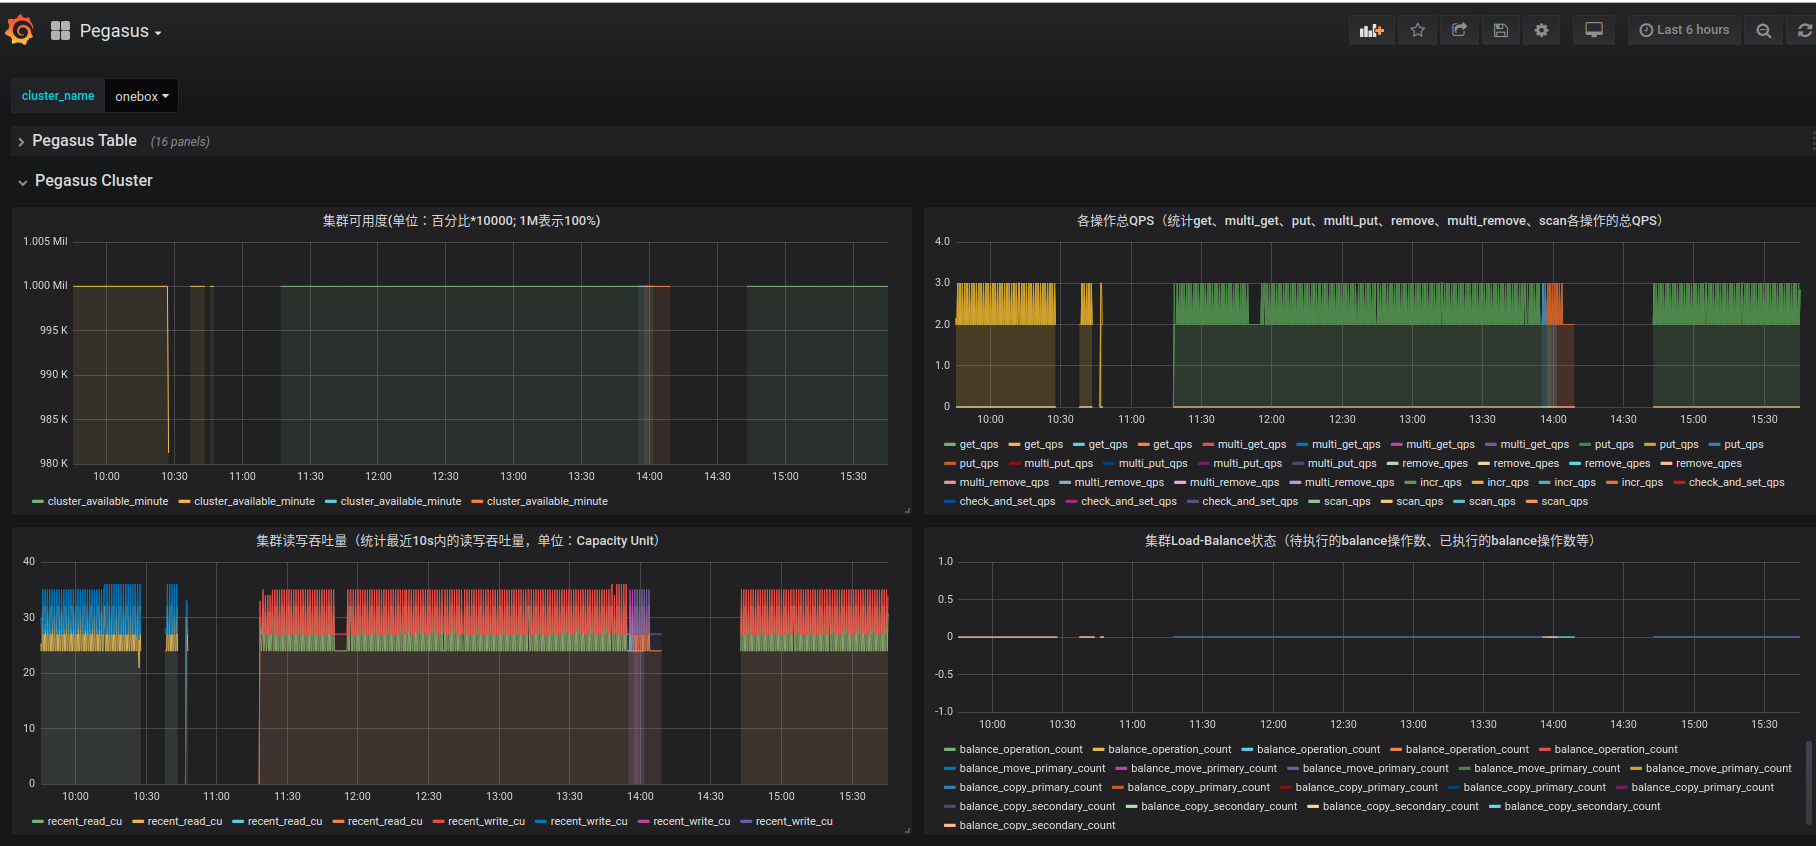
The dashboard contains two rows: Pegasus-Cluster and Pegasus-Table, representing cluster-level and table-level monitoring. Enter the specific cluster name in the cluster_name control at the top-left to view the corresponding metrics of that cluster.