本文档主要介绍Pegasus负载均衡的概念、使用和设计。
概念篇
在Pegasus中,负载均衡主要包括以下几个方面的内容:
- 如果某个partition不满足一主两备,要选择一个机器将缺失的分片补全。这个过程在Pegasus中叫做
cure。 - 当所有的分片都满足一主两备份后,对集群各个replica server上分片的个数做调整,尽量让每个机器上服务的分片数都维持在一个相近的水平上。这个过程在Pegasus中叫做
balance。 - 如果一个replica server上挂载了多个磁盘,并且通过配置文件
data_dirs提供给Pegasus使用。replica server要尽量让每个磁盘上分片的数量都维持在一个相近的水平上。
围绕这几点内容,Pegasus引入了一些概念方便描述这些情况:
-
Partition的健康状况
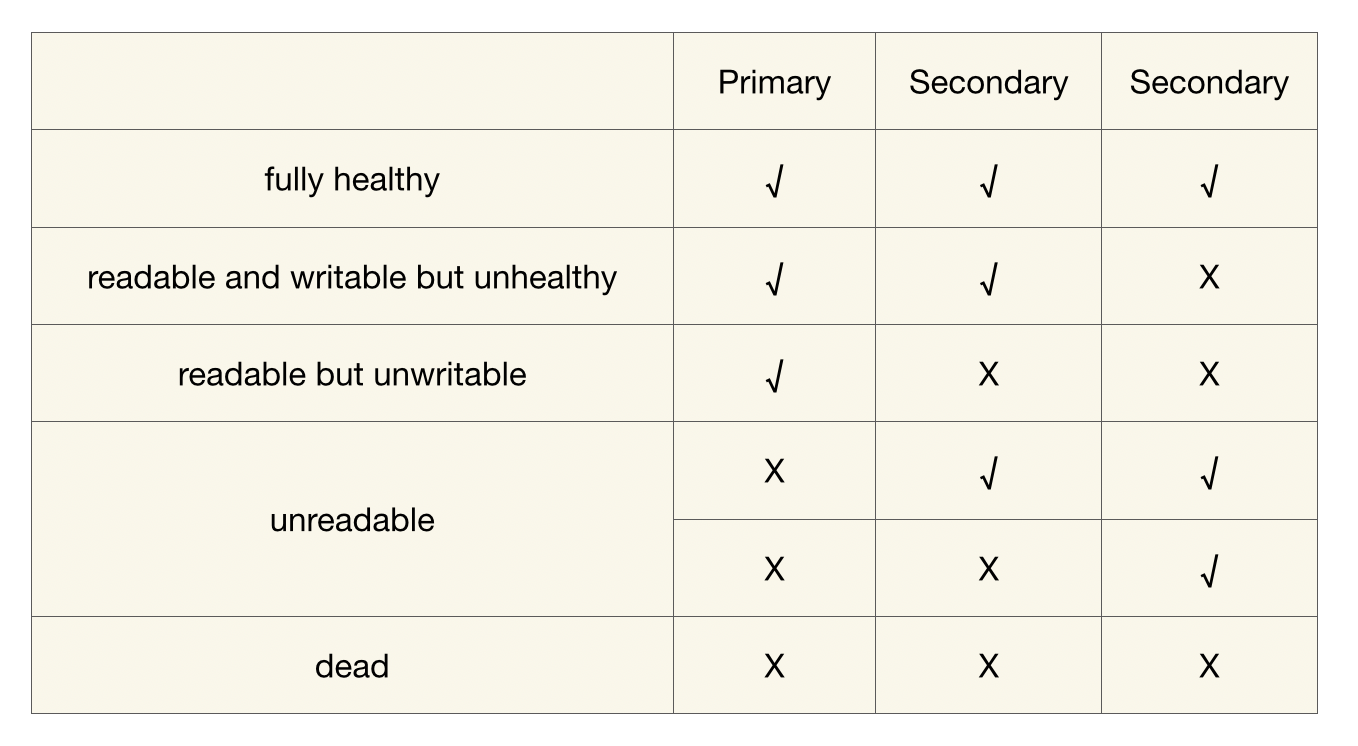
Pegasus为Partition定义了几种健康状况:
- 【fully healthy】: 健康的,完全满足一主两备
- 【unreadable】: 分片不可读了。指的是分片缺少primary, 但有一个或两个secondary。
- 【readable but unwritable】: 分片可读但是不可写。指的是只剩下了一个primary,两个secondary副本全部丢失
- 【readable and writable but unhealthy】: 分片可读可写,但仍旧不健康。指的是三副本里面少了一个secondary
- 【dead】: partition的所有副本全不可用了,又称之为DDD状态。
当通过pegasus shell来查看集群、表以及分片的状态时,会经常看到对分片健康情况的整体统计或单个描述。譬如通过
ls -d命令,可以看到各个表处于不同健康状况的partition的个数,包括这些:- fully_healthy:完全健康。
- unhealthy:不完全健康。
- write_unhealthy:不可写,包括上面的readable but unwritable和dead。
- read_unhealthy:不可读,包括上面的unreadable和dead。
-
Meta server的运行level
meta server的运行level决定了meta server会对整个分布式系统做到何种程度的管理。最常用的运行level包括:
- blind:在这种运行level之下,meta_server拒绝任何可能会修改元数据状态的操作。一般在做zookeeper迁移的时候会用到这个level。
- steady:在这种运行level下,meta server只做
cure,即只处理unhealthy的partition。 - lively:在这种运行level下,一旦所有partion都进入了healthy, meta server就会尝试进行
balance,来调整各个机器的分片数。
操作篇
观察系统情况
可以通过pegasus的shell客户端来观察系统的Partition情况:
-
nodes -d
可以用来观察系统中每个节点的partition个数:
>>> nodes -d
address              status              replica_count       primary_count       secondary_count
10.132.5.1:32801     ALIVE               54                  18                  36
10.132.5.2:32801     ALIVE               54                  18                  36
10.132.5.3:32801     ALIVE               54                  18                  36
10.132.5.5:32801     ALIVE               54                  18                  36
如果节点间的partition个数分布差异太大,可以采用”set_meta_level lively”的命令来进行调整。
-
app
-d 可以用来某张表的所有partition的分布情况:可以观察到某个具体partition的组成,也可以汇总每个节点服务该表的partition个数。
>>> app temp -d [Parameters] app_name: temp detailed: true [Result] app_name : temp app_id : 14 partition_count : 8 max_replica_count : 3 details : pidx ballot replica_count primary secondaries 0 22344 3/3 10.132.5.2:32801 [10.132.5.3:32801,10.132.5.5:32801] 1 20525 3/3 10.132.5.3:32801 [10.132.5.2:32801,10.132.5.5:32801] 2 19539 3/3 10.132.5.1:32801 [10.132.5.3:32801,10.132.5.5:32801] 3 18819 3/3 10.132.5.5:32801 [10.132.5.3:32801,10.132.5.1:32801] 4 18275 3/3 10.132.5.5:32801 [10.132.5.2:32801,10.132.5.1:32801] 5 18079 3/3 10.132.5.3:32801 [10.132.5.2:32801,10.132.5.1:32801] 6 17913 3/3 10.132.5.2:32801 [10.132.5.1:32801,10.132.5.5:32801] 7 17692 3/3 10.132.5.1:32801 [10.132.5.3:32801,10.132.5.2:32801] node primary secondary total 10.132.5.1:32801 2 4 6 10.132.5.2:32801 2 4 6 10.132.5.3:32801 2 4 6 10.132.5.5:32801 2 4 6 8 16 24 fully_healthy_partition_count : 8 unhealthy_partition_count : 0 write_unhealthy_partition_count : 0 read_unhealthy_partition_count : 0 list app temp succeed -
server_stat
可以用来观察各个replica server当前的一些监控数据。如果想分析流量的均衡程度,要重点观察各个操作的qps和latency。对于数据值明显异常的节点(和其他节点差异太大),需要排查下partition个数是不是分布不均,或者是不是出现了某个分片的读写热点。
>>> server_stat -t replica-server COMMAND: server-stat CALL [replica-server] [10.132.5.1:32801] succeed: manual_compact_enqueue_count=0, manual_compact_running_count=0, closing_replica_count=0, disk_available_max_ratio=88, disk_available_min_ratio=78, disk_available_total_ratio=85, disk_capacity_total(MB)=8378920, opening_replica_count=0, serving_replica_count=54, commit_throughput=0, learning_count=0, shared_log_size(MB)=4, memused_res(MB)=2499, memused_virt(MB)=4724, get_p99(ns)=0, get_qps=0, multi_get_p99(ns)=0, multi_get_qps=0, multi_put_p99(ns)=0, multi_put_qps=0, put_p99(ns)=0, put_qps=0 CALL [replica-server] [10.132.5.2:32801] succeed: manual_compact_enqueue_count=0, manual_compact_running_count=0, closing_replica_count=0, disk_available_max_ratio=88, disk_available_min_ratio=79, disk_available_total_ratio=86, disk_capacity_total(MB)=8378920, opening_replica_count=0, serving_replica_count=54, commit_throughput=0, learning_count=0, shared_log_size(MB)=4, memused_res(MB)=2521, memused_virt(MB)=4733, get_p99(ns)=0, get_qps=0, multi_get_p99(ns)=0, multi_get_qps=0, multi_put_p99(ns)=0, multi_put_qps=0, put_p99(ns)=0, put_qps=0 CALL [replica-server] [10.132.5.3:32801] succeed: manual_compact_enqueue_count=0, manual_compact_running_count=0, closing_replica_count=0, disk_available_max_ratio=90, disk_available_min_ratio=78, disk_available_total_ratio=85, disk_capacity_total(MB)=8378920, opening_replica_count=0, serving_replica_count=54, commit_throughput=0, learning_count=0, shared_log_size(MB)=4, memused_res(MB)=2489, memused_virt(MB)=4723, get_p99(ns)=0, get_qps=0, multi_get_p99(ns)=0, multi_get_qps=0, multi_put_p99(ns)=0, multi_put_qps=0, put_p99(ns)=0, put_qps=0 CALL [replica-server] [10.132.5.5:32801] succeed: manual_compact_enqueue_count=0, manual_compact_running_count=0, closing_replica_count=0, disk_available_max_ratio=88, disk_available_min_ratio=82, disk_available_total_ratio=85, disk_capacity_total(MB)=8378920, opening_replica_count=0, serving_replica_count=54, commit_throughput=0, learning_count=0, shared_log_size(MB)=4, memused_res(MB)=2494, memused_virt(MB)=4678, get_p99(ns)=0, get_qps=0, multi_get_p99(ns)=0, multi_get_qps=0, multi_put_p99(ns)=0, multi_put_qps=0, put_p99(ns)=0, put_qps=0 Succeed count: 4 Failed count: 0 -
app_stat -a
可以用来观察某个表中,各个partition的统计信息。对于数据值明显异常的分片,要关注是不是出现了分片热点。
>>> app_stat -a temp
pidx                 GET   MULTI_GET         PUT   MULTI_PUT         DEL   MULTI_DEL        INCR         CAS        SCAN     expired    filtered    abnormal  storage_mb  file_count
0                      0           0           0           0           0           0           0           0           0           0           0           0           0           3
1                      0           0           0           0           0           0           0           0           0           0           0           0           0           1
2                      0           0           0           0           0           0           0           0           0           0           0           0           0           4
3                      0           0           0           0           0           0           0           0           0           0           0           0           0           2
4                      0           0           0           0           0           0           0           0           0           0           0           0           0           3
5                      0           0           0           0           0           0           0           0           0           0           0           0           0           2
6                      0           0           0           0           0           0           0           0           0           0           0           0           0           1
7                      0           0           0           0           0           0           0           0           0           0           0           0           0           3
                       0           0           0           0           0           0           0           0           0           0           0           0           0          19
控制集群的负载均衡
Peagsus提供以下几种命令来控制集群的负载均衡:
-
set_meta_level
这个命令用来控制meta的运行level,支持以下几种level:
- freezed:meta server会停止unhealthy partition的cure工作,一般在集群出现较多节点宕机或极其不稳定的情况下使用,另外如果集群的节点数掉到一个数量或者比例以下(通过配置文件
min_live_node_count_for_unfreeze和node_live_percentage_threshold_for_update控制)就会自动变为freezed,等待人工介入。 - steady:meta server的默认level, 只做cure,不做balance。
- lively:meta server会调整分片数,力求均衡。
可以使用
cluster_info或者get_meta_level查看当前集群的运行level。关于调整的一些建议:
- 先用shell的
nodes -d命令查看集群是否均衡,当不均衡时再进行调整。通常在以下几种情况发生后,需要开启lively进行调整:- 新创建了表,这个时候分片数目可能不均匀。
- 集群上线、下线、升级了节点,这时候分片数目也可能不均匀。
- 有节点宕机,一些replica迁移到了别的节点上。
- 调整过程会触发replica迁移,影响集群可用度,虽然影响不大,但是如果对可用度要求很高,并且调整需求不紧急,建议在低峰时段进行调整。
- 调整完成后通过
set_meta_level steady将level重置为steady状态,避免在平时进行不必要的replica迁移,减少集群抖动。 - Pegasus还提供了一些精细控制balance的命令,参见负载均衡的高级选项。
- freezed:meta server会停止unhealthy partition的cure工作,一般在集群出现较多节点宕机或极其不稳定的情况下使用,另外如果集群的节点数掉到一个数量或者比例以下(通过配置文件
-
balance
balance命令用来手动发送分片迁移的命令。支持的迁移类型:
- move_pri:把某个partition下的primary和secondary做调换(本质上为两步:1.将from降级;2.将to升级。如果meta server在第1步完成后挂掉,新的meta server不会继续进行第2步,可以视为move_pri命令被中断了)
- copy_pri:把某个partition下的primary迁移到一个新节点下
- copy_sec:把某个partition下的secondary迁移到一个新节点下
注意在使用时,请保证meta server处在steady状态,不然命令无法生效。
参见以下样例(不相关的输出已经被删去):
>>> get_meta_level current meta level is fl_steady >>> app temp -d pidx ballot replica_count primary secondaries 0 3 3/3 10.231.58.233:34803 [10.231.58.233:34802,10.231.58.233:34801] list app temp succeed >>> balance -g 1.0 -p move_pri -f 10.231.58.233:34803 -t 10.231.58.233:34802 send balance proposal result: ERR_OK >>> app temp -d pidx ballot replica_count primary secondaries 0 5 3/3 10.231.58.233:34802 [10.231.58.233:34801,10.231.58.233:34803] list app temp succeed -
propose
propose命令用来发送更低原语的分片调整命令,主要有以下几种:
- assign_primary:把某个partition的primary分配到某台机器上
- upgrade_to_primary:把某个partition的secondary升级为primary
- add_secondary: 为某个partition添加secondary
- upgrade_to_secondary: 把某个partition下的某个learner升级为secondary
- downgrade_to_secondary:把某个partition下的primary降级为secondary
- downgrade_to_inactive:把某个partition下的primary/secondary降级为inactive状态
- remove:移除掉某个partition下的某个副本
>>> app temp -d pidx ballot replica_count primary secondaries 0 5 3/3 10.231.58.233:34802 [10.231.58.233:34801,10.231.58.233:34803] list app temp succeed >>> propose -g 1.0 -p downgrade_to_inactive -t 10.231.58.233:34802 -n 10.231.58.233:34801 send proposal response: ERR_OK >>> app temp -d pidx ballot replica_count primary secondaries 0 7 3/3 10.231.58.233:34802 [10.231.58.233:34803,10.231.58.233:34801] list app temp succeed在上面的例子中,propose命令希望把10.231.38.233:34801降级。所以需要把这个命令发给partition的primary(10.231.58.233:34802),由它来执行具体某个副本降级的事宜。注意这里体现了pegasus系统的设计理念:meta server负责管理primary , pimary负责管理partition下的其他副本。
上面的例子也许看不出10.231.38.233:34801被降级的痕迹。这是因为系统cure功能的存在,对于unhealthy的partition会迅速修复。你可以通过观察ballot的变化来确认这个命令已经生效了。
正常情况下,你应该不会需要使用到propose命令。
负载均衡的高级选项
meta server提供了一些更细粒度的参数用来做负载均衡的控制。这些参数是通过remote_command命令来调整的:
通过help查看所有的remote_command
>>> remote_command -l 127.0.0.1:34601 help
COMMAND: help

CALL [user-specified] [127.0.0.1:34601] succeed: help|Help|h|H [command] - display help information
repeat|Repeat|r|R interval_seconds max_count command - execute command periodically
...
meta.lb.assign_delay_ms [num | DEFAULT]
meta.lb.assign_secondary_black_list [<ip:port,ip:port,ip:port>|clear]
meta.lb.balancer_in_turn <true|false>
meta.lb.only_primary_balancer <true|false>
meta.lb.only_move_primary <true|false>
meta.lb.add_secondary_enable_flow_control <true|false>
meta.lb.add_secondary_max_count_for_one_node [num | DEFAULT]
...

Succeed count: 1
Failed count: 0
remote_command是pegasus的一个特性, 允许一个server注册一些命令,然后命令行可以通过rpc调用这些命令。这里我们使用help来访问meta server leader,获取meta server端支持的所有命令。例子中已经略掉了所有不相关的行,只留下以”meta.lb”开头的所有和负载均衡相关的命令。
由于文档和代码的不一致问题,文档里不一定覆盖了当前meta所有的lb控制命令。如果想获取最新的命令列表,请用最新的代码手动执行一下help。
assign_delay_ms
assign_delay_ms用来控制当partition缺少一个secondary时,我们要延时多久才选择一个新的。之所以这么做,是因为一个副本的掉线可能是临时性的,如果不给予一定的缓冲就选择新的secondary, 可能会导致巨量的数据拷贝。
>>> remote_command -t meta-server meta.lb.assign_delay_ms
COMMAND: meta.lb.assign_delay_ms
CALL [meta-server] [127.0.0.1:34601] succeed: 300000
CALL [meta-server] [127.0.0.1:34602] succeed: unknown command 'meta.lb.assign_delay_ms'
CALL [meta-server] [127.0.0.1:34603] succeed: unknown command 'meta.lb.assign_delay_ms'
Succeed count: 3
Failed count: 0
>>> remote_command -t meta-server meta.lb.assign_delay_ms 10
COMMAND: meta.lb.assign_delay_ms 10
CALL [meta-server] [127.0.0.1:34601] succeed: OK
CALL [meta-server] [127.0.0.1:34602] succeed: unknown command 'meta.lb.assign_delay_ms'
CALL [meta-server] [127.0.0.1:34603] succeed: unknown command 'meta.lb.assign_delay_ms'
Succeed count: 3
Failed count: 0
>>> remote_command -t meta-server meta.lb.assign_delay_ms
COMMAND: meta.lb.assign_delay_ms
CALL [meta-server] [127.0.0.1:34601] succeed: 10
CALL [meta-server] [127.0.0.1:34602] succeed: unknown command 'meta.lb.assign_delay_ms'
CALL [meta-server] [127.0.0.1:34603] succeed: unknown command 'meta.lb.assign_delay_ms'
Succeed count: 3
Failed count: 0
如例所示,命令不加参数表示返回当前设定的值。加参数表示期望的新值。
assign_secondary_black_list
该命令用来设定添加secondary的黑名单。这个命令在批量下线集群节点的时候非常有用.
add secondary时候的流控
在某些时候, 负载均衡的决策算法可能会要求一个机器上要新增不少secondary副本, 如
- 一个或多个节点的宕机,会导致正常的节点瞬时接受很多的芬片
- 新节点的加入,可能会有大量的涌入。
但在执行这些增加分片的决策动作时,我们应该避免同一时刻有大量的secondary分片同时添加, 因为
- 添加secondary副本基本会涉及数据拷贝, 如果量太大可能会对正常读写造成影响
- 带宽总量是有限的, 如果由分给多个添加分片的任务去分享这些带宽, 那么每个任务执行的时常都会拉长, 从而让系统长期处在一个大量分片都不健康的状态下, 增加了稳定性的风险。
所以, pegasus用两个命令来对流控做支持:
- meta.lb.add_secondary_enable_flow_control: 表示是否开启流控的feature。
- meta.lb.add_secondary_max_count_for_one_node: 表示对于每个节点,同时执行多少个add_secondary的动作。
精细控制balancer
在目前的pegasus实现中,balancer过程大概可以用四点来概括:
- 尽量通过角色互换来做到primary均衡
- 如果1做不到让primary变均匀,通过拷数据来做到primary均衡
- 在2做完后,通过拷数据做到secondary的均衡
- 分别针对每个表做1-2-3的动作
Pegasus提供了一些控制参数给些过程可以提供更精细的控制:
- meta.lb.only_primary_balancer: 对于每个表,只进行1和2(减少copy secondary带来的数据拷贝)
- meta.lb.only_move_primary: 对于每个表,primary调节的时候只考虑方法1(减少copy primary带来的数据拷贝)
- meta.lb.balancer_in_turn:各个表的balancer用串行的方式做,而不是并行进行(用于调试,观察系统行为)
一些命令的使用案例
通过把上面的这些负载均衡原语结合起来,pegasus提供了一些一些脚本来执行滚动升级、节点下线等一些操作,如:
-
这个脚本用来把某个节点上服务的所有primary都赶走
-
scripts/pegasus_rolling_update.sh
用来对集群中的节点做在线滚动升级
-
scripts/pegasus_offline_node_list.sh
用来做一批节点的下线
不过有部分脚本的逻辑依赖小米的minos部署系统。这里希望大家可以帮助pegasus, 可以支持更多的部署系统。
集群级别负载均衡
- 上面的描述都是以表为单位进行负载均衡的,即当一个集群中每张表在replica server上是均衡的,meta server就认为整个集群是均衡的。
- 然而,在部分场景下,特别是集群replica server节点数较多,集群中存在大量小分片表时,即使每张表是均衡的,整个集群也不是均衡的。
- 从2.3.0版本开始,Pegasus支持集群级别的负载均衡,在保障不改变表均衡的情况下让整个集群的replica个数均衡。
其使用方式和上面描述方法相同,并且支持上述所有的命令。
如果需要使用集群级别负载均衡,需要修改以下配置:
[[meta_server]]
   balance_cluster = ture  // 默认为false
设计篇
在当前Pegasus balancer的实现中,meta server会定期对所有replica server节点的replica情况做评估,当其认为replica在节点分布不均衡时,会将相应replica进行迁移。 在balancer生成决策过程中需要考虑的因素有:
- 对于任意表,其partition在节点上的分布要均衡,这其中包括如下几个方面:
- 某个partition的三个副本不能全部落在一个节点上
- Primary的数量要均摊
- Secondary的数量也要均摊
- 如果发现Primary分配不均衡时,首先考虑的策略应该是对Primary进行角色切换,而不是直接就进行数据拷贝
- 不仅要考虑节点间的负载均衡,也要尽量保证节点内各个磁盘的replica个数是均衡的
Move_Primary
当primary分布不均衡时,首先考虑的策略是对进行角色切换,也就是说,需要寻找到一条从路径,将primary从“多方”迁移到“少方”。将迁移的primary数量作为流量,很自然的我们就想到了Ford-Fulkerson,即:
- 寻找一条从source到sink的增广路径
- 按照增广路径修改各边权重,形成残差网络
- 在残差网络中继续步骤1,直到找不到增广路径为止。
但是我们又不能直接套用Ford-Fulkerson。原因在于第2步中,按照Ford-Fulkerson,增广路上的一条权重为x的边意味着从A流向B的primary的个数为x,此时形成残差网络中,该边的权重需要减去x,然而其反向边也同时增加x(反向边的作用用于提供一个调整的机会,因为之前形成的增广路径很有可能不是最大流,该反向边用于调整此前形成的增广路径,具体参考Ford-Fulkerson算法)。但是在我们的模型中,反向边增加x是不合理的,例如,对于Partition[Primary: A, Secondary: (B, C)],Primary从A向B流动,最终使得Partition成为[Primary: B, Secondary: (A, C)],这时意味着:
- A到B的流量减少
- A到C的流量减少
- B到A的流量增加
- B到C的流量增加
这显然与Ford-Fulkerson的残差网络的反向边的权重变化是不同的。 所以我们将算法修改如下:
- 按照当前的partition分布生成图结构,并根据Ford-Fulkerson算法,找到一条增广路径
- 根据找到的增广路径,构造primary角色切换的决策动作。并在集群中执行该动作,生成新的partition分布
- 根据新的partition分布,迭代步骤1,一直到不能找到增广路径
从上面可以看出,该算法主要是对第2步进行了修改,并非像Ford-Fulkerson算法那样简单的进行边权重修改。
NOTE:我们在执行Ford-Fulkerson进行primary迁移的时候,是针对单个表的,也就是说构造网络、执行角色切换都是针对单个表的,当要对多个表进行迁移,则只要循环对所有表各执行上述流程就可以了。
Copy_Primary
当没有成功获取增广路径时,则说明简单通过角色切换的方式已经无法达到负载均衡了,必须通过迁移Primary来实现了。 迁移Primary算法的实现相对简单,其具体执行步骤如下:
- 将节点按照Primary数量按从小到大排序,得到pri_queue
- 对pri_queue上,id_min始终指向pri_queue的头结点,id_max始终指向pri_queue的尾节点,如下图所示:
+------+------+------+------+------+------+------+------+ | | V V id_min id_max - 对当前id_max上的所有Primary,分别找到其对应的磁盘并获取其磁盘负载,选择负载最大的磁盘及其对应的Primary,进行迁移
- 对当前id_min/id_max指向的Primary数量分别+1/-1。重新排序,并循环执行上述步骤,直到id_min节点上的Primary数量 >= N/M,此时说明达到了平衡
Copy_Secondary
上述讲解了Primary负载均衡,当然Secondary也同样需要负载均衡,否则的话可能会出现不同节点上Primary均衡,但是partition总数不均衡的情况。 因为在做Primary迁移时已经做过角色切换了,Secondary迁移就不用像Primary这么复杂,不用考虑角色切换的问题了。此时直接进行copy就可以。因此Secondary的负载均衡,直接采用copy Primary一样的算法实现,这里不再赘述。 同理,Secondary也要对所有表分别进行负载均衡。
NOTE: 上述构建图、查找增广路径、Move_Primary、Copy_Primary、Copy_Secondary都是针对一个表进行的操作,对于集群上的多个表,都要执行一次上述步骤。