组件
从v1.12.0开始, Pegasus 支持使用 Prometheus 和 Grafana 进项监控项的采集和展示。
- Prometheus
Prometheus 是一款开源的系统监控和报警套件。它可以通过将采集被监控系统的监控项存入自身的时序数据库中,并且通过丰富的多维数据查询语言,满足用户的不同数据展示需求。
- Grafana
Grafana 是一款开源的数据分析和展示平台。支持包括 Prometheus 在内的多个主流时序数据库源。通过对应的数据库查询语句,从数据源中获取展现数据。通过灵活可配置的 Dashboard,快速的将这些数据以图表的形式展示给用户。
注意*
本文档仅提供一种使用 Prometheus 和 Grafana 进行 Pegasus 监控数据采集和展示的方式。Pegasus 不包含、不维护这些组件。更多关于这些组件的详细介绍,请移步对应官方文档进行查阅。
配置 Prometheus
本小节介绍如何配置 Prometheus。
第一步: 配置Pegasus服务
Pegasus 默认不向任何外部系统推送监控信息, 你需要修改配置文件以启用 prometheus 推送。具体如下:
[pegasus.server]
  perf_counter_sink = prometheus
  prometheus_port = 9091
注: 如果你想要测试你的 Pegasus 节点是否正确开启了 Prometheus 推送, 可以检查
http://{pegasus_host}:{prometheus_port}/metrics是否能正常访问.
Onebox 使用 Prometheus
如果使用 onebox, 请首先修改配置文件 src/server/config.min.ini 以开启 Prometheus 推送. 但不需要改动 prometheus_port.
[pegasus.server]
  perf_counter_sink = prometheus
  prometheus_port = @PROMETHEUS_PORT@
由于 onebox 模式下多个 Pegasus 服务进程部署在一台机器上,因此各 replica、meta、collector 的 prometheus 端口存在冲突问题. 当前我们的解决办法是对每个进程配置单独的 prometheus port:
- collector : 9091
- meta: [9092, 9093, 9094…]
- replica: [9092+{META_COUNT}, 9093+{META_COUNT}, 9094+{META_COUNT}…]
例如一个 2 meta, 3 replica, 1 collector 的 onebox 集群, 其端口对应如下:
./run.sh start_onebox -r 3 -m 2 -c
- meta1: 9092, meta2: 9093
- replica1: 9094, replica2: 9095, replica3: 9096
第二步: 安装及运行 Prometheus
wget https://github.com/prometheus/prometheus/releases/download/v2.15.2/prometheus-2.15.2.linux-amd64.tar.gz
tar xvfz prometheus-2.15.2.linux-amd64.tar.gz
cd prometheus-2.15.2.linux-amd64
修改 prometheus 目录下的 prometheus.yml 文件,配置模板如下所示:
global:
  scrape_interval: 5s

scrape_configs:
  - job_name: 'pegasus'
    static_configs:
      - targets: ['collector_host:9091']
        labels:
          group: collector

      - targets: ['meta_host1:9091', 'meta_host2:9091', 'meta_host3:9091']
        labels:
          group: meta

      - targets: ['replica_host1:9091', 'replica_host2:9091', 'replica_host3:9091']
        labels:
          group: replica
      #
      # NOTE: Add the following lines if node exporter is deployed.
      # - targets:
      #     [
      #       'node_exporter_host1:9100',
      #       'node_exporter_host2:9100',
      #       ...
      #       'node_exporter_hostn:9100',
      #     ]
      #   labels:
      #     group: node_exporter
对于上述通过 ./run.sh start_onebox -r 3 -m 2 -c 启动的 onebox 集群, 实际配置如下:
global:
  scrape_interval: 5s

scrape_configs:
  - job_name: "pegasus"
    static_configs:
      - targets: ["0.0.0.0:9091"]
        labels:
          group: collector

      - targets: ["0.0.0.0:9092", "0.0.0.0:9093"]
        labels:
          group: meta

      - targets: ["0.0.0.0:9094", "0.0.0.0:9095", "0.0.0.0:9096"]
        labels:
          group: replica
修改完 prometheus.yml 之后,启动 prometheus:
./prometheus --config.file=prometheus.yml
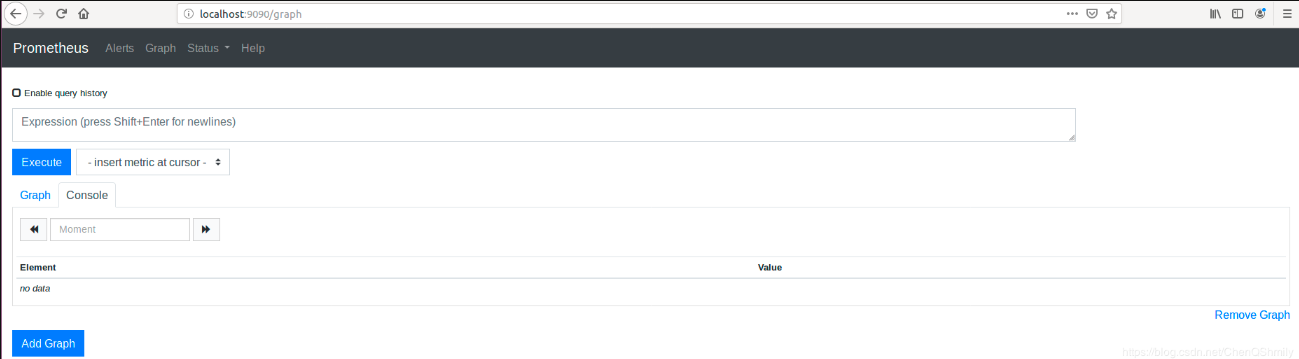
进入网址 localhost:9090 看到如下界面即表示到这一步为止是成功的。
注: 如果你想要测试 Prometheus 是否正确配置, 可以检查
http://{prometheus_host}:9090/targets查看各节点的监控上报状态.
在 Expression 框内输入需要查找的内容,点击 Execute 即可在 Element 中展示查找到的内容,当选择 Graph 时可以显示该内容一段时间内数值变化情况。
注意
-
实际运维过程中, 我们通常需要获取一些机器及操作系统的监控指标, 如 cpu.busy, disk.iostat 等等, 所以在部署 Pegasus 集群的时候,可以考虑在每一台机器上部署一个 node exporter 后台实例,具体可参考: Node Exporter
-
Alert Manager 为 Prometheus 报警组件,需单独部署(暂不提供方案,可参照官方文档自行搭建)。通过 Alert Manager,用户可以配置报警策略,接收邮件、短信等报警。
-
目前我们的 prometheus.yml 使用的是静态配置的方式(static_configs),其缺点是当动态扩容缩容的时候需要手动去修改该静态配置。当前 Prometheus 支持多种动态服务发现方式,例如 k8s、consul 和 dns 等等,用户也可以根据自己需求去定制实现。详情请参考文档:配置文件说明、实现动态服务发现
配置 Grafana
本小节介绍如何配置 Grafana。
第一步: 安装及运行 Grafana
首先下载 grafana 二进制包:
wget https://dl.grafana.com/oss/release/grafana-6.0.0.linux-amd64.tar.gz //如果报错,可以尝试在后面添加--no-check-certificate
tar -zxvf grafana-6.0.0.linux-amd64.tar.gz
cd grafana-6.0.0
启动 Grafana
./bin/grafana-server web
观察到如下输出,即为启动成功
INFO[07-24|14:36:59] Starting Grafana                         logger=server version=6.0.0 commit=34a9a62 branch=HEAD compiled=2019-02-25T22:47:26+0800
...
INFO[07-24|14:37:00] HTTP Server Listen                       logger=http.server address=0.0.0.0:3000 protocol=http subUrl= socket=
INFO[07-24|14:37:00] cleanup of expired auth tokens done      logger=auth count=2
第二步: 添加 Prometheus 数据源
-
登录 Grafana 界面。如下图所示:

- 默认地址:http://localhost:3000
- 默认账户:admin
- 默认密码:admin
注意:
Change Password 步骤可以选择 Skip。
-
点击 Grafana 侧边栏菜单 Configuration 中的 Data Source。
-
点击 Add data source。
-
指定数据源的相关信息:
- 在 Name 处,为数据源指定一个名称。
- 在 Type 处,选择 Prometheus。
- 在 URL 处,指定 Prometheus 的 IP 地址。
- 根据需求指定其它字段。
-
点击 Add 保存新的数据源。
第三步: 导入 Pegasus DashBoard
目前 Pegasus 拥有一个 DashBoard,用于提供一些基本的监控信息。其相应的 json 文件: Pegasus json 文件
下载了 json 文件后,可以通过 import 的方式将其导入进去。其步骤如下:
进入 grafana,点击左边框的 “+”,选择 import,进入 import 页面 。
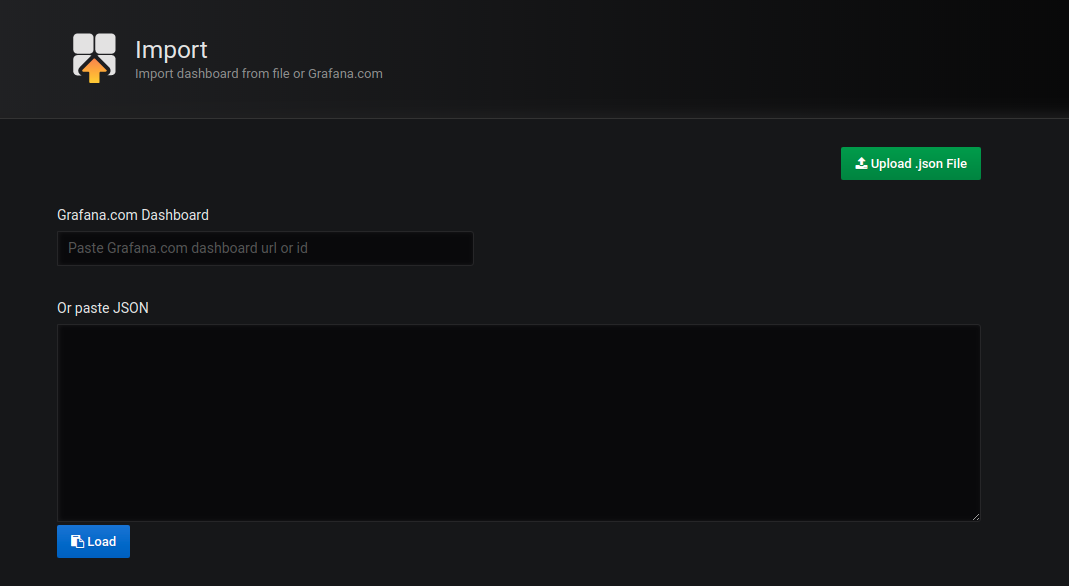
点击右上角的”Upload .json File”,然后选择文件。选择之后进入如下页面
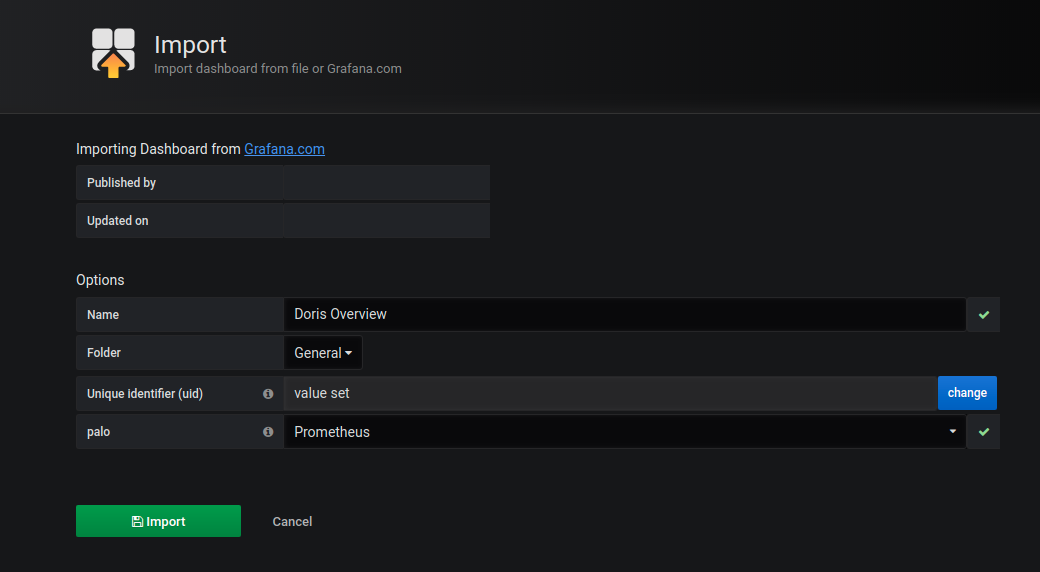
然后点击左下角的”import”按钮完成导入,并进入到 Pegasus 相应的 DashBoard,其页面如下所示
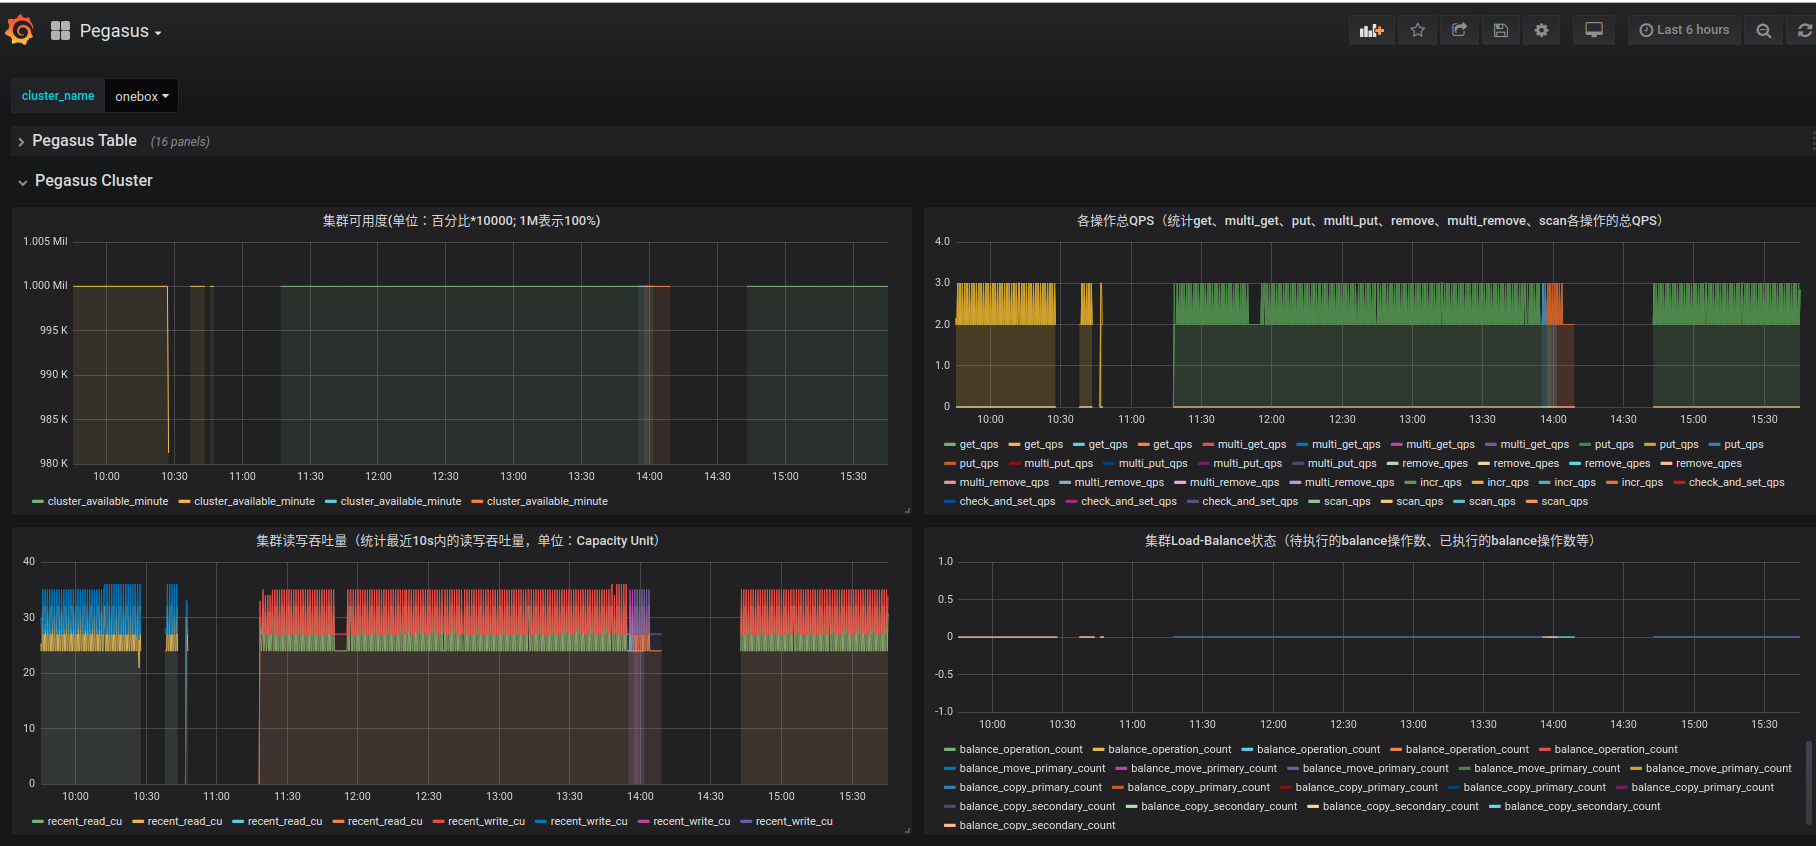
从图中可以看出,Pegasus 的 DashBoard 分为两个 row: Pegasus-Cluster 和 Pegasus-Table,分别代表集群级别监控和表级监控。在左上角的 cluster_name 后输入具体的集群名字,便可以查看该集群相应的各种监控信息。